scatlastb_utils.pl.qc_joint#
- scatlastb_utils.pl.qc_joint(adata, x, y, log_x=1, log_y=1, hue=None, main_plot_function=None, main_plot_kwargs=None, marginal_plot_function=None, marginal_hue=None, x_threshold=None, y_threshold=None, title='', return_df=False, marginal_kwargs=None, **kwargs)#
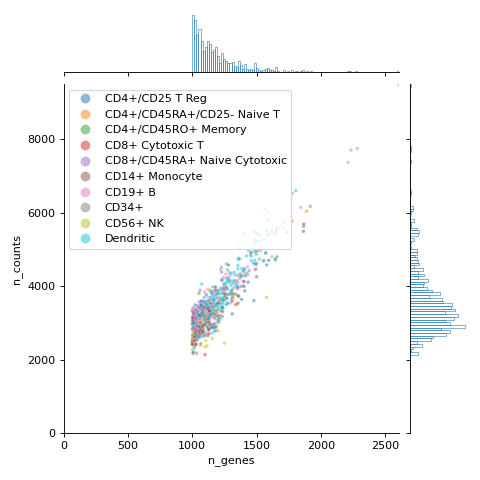
Plot scatter plot with marginal histograms from df columns.
This function wraps the seaborn.JointGrid function
- Parameters:
adata (
AnnData) – AnnData object containing axes to be plotted in joint plot.x (
str) – Column inadata.obsfor x axis.y (
str) – Column inadata.obsfor y axis.log_x (
int(default:1)) – Log base for transforming x axis before plotting. Default 1, no transformation.log_y (
int(default:1)) – Log base for transforming y axis before plotting. Default 1, no transformation.hue (
str(default:None)) – Column inadata.obswith annotations for color coding scatter plot points.main_plot_function (
Callable(default:None)) – Function to use for the main joint plot. Defaults toseaborn.scatterplot.marginal_plot_function (
Callable(default:None)) – Function to use for the marginal plot passed to seaborn’s JointGrid.plot_marginals functionmarginal_kwargs (
dict(default:None)) – Additional keyword arguments passed to the marginal plots (histograms/KDEs).x_threshold (default:
None) – Tuple of upper and lower filter thresholds for x axis.y_threshold (default:
None) – Tuple of upper and lower filter thresholds for y axis.title (default:
'') – Title text for plot.return_df (default:
False) – IfTrue, return the DataFrame used for plotting along with the JointGrid.**kwargs – Additional keyword arguments passed to the main plot function.
main_plot_kwargs (dict)
marginal_hue (str)
- Returns:
- g
A
seaborn.axisgrid.JointGridobject.- out_df
A
pandas.DataFramewith updated values. Only returned ifreturn_dfisTrue.
Examples
import scanpy as sc
import scatlastb_utils as atl

adata = sc.datasets.pbmc68k_reduced()
atl.pl.qc_joint(
    adata,
    x="n_genes",
    y="n_counts",
    hue="bulk_labels",
    # additional kwargs to pass to main_plot_function
    s=10,
    alpha=0.5,
)